What do megakaryocytes, machine learning, and a team of Oxford scientists have in common? They’re all part of Dr. Daniel Royston’s mission to teach computers how to see what pathologists might miss — the secret signs of fibrosis hiding in the bone marrow. In this month’s Researcher Spotlight, step inside a one-of-a-kind laboratory where engineers and hematopathologists are training an AI “apprentice” that could someday help diagnose MPNs with unprecedented clarity.
Profile:
Daniel Royston, MBChB, BMSC, DPhil, FRCPath
University of Oxford

Late-stage bone marrow fibrosis is unmistakable. But in the beginning, it’s easy to overlook, even though the stakes couldn’t be higher.
For 2024 MPN Challenge™ awardee Dr. Daniel Royston, MBChB, BMSC, DPhil, FRCPath, a pathologist and scientist at the University of Oxford, the real challenge in myeloproliferative neoplasms (MPNs) isn’t seeing it on a microscope slide. The challenge is capturing the complexity of the bone marrow in a way that others — whether human or machine — can understand, measure, and act on.
In his Oxford laboratory, Royston is training machine learning models to recognize what the human eye alone cannot measure. These models — computer programs trained to find patterns in complex data — aren’t off-the-shelf tools. They’re more like apprentices, requiring instruction, refinement, and a fair amount of patience. With the right training, Royston’s models could help pathologists around the world detect the early and subtle signs of MPNs that too often hide in plain sight.
When pathologists and engineers learn each other’s language
The answer to Royston’s challenge didn’t start with a computer. It started with compiling “a laboratory makeup that probably wouldn’t have existed 10 years ago,” Royston says.
Royston assembled a group as varied and interdependent as the bone marrow they study: clinical pathologists, hematologists, biomedical engineers, and computer scientists. Each discipline brings its own lens, methods, and assumptions — and each must learn to work with the others to tackle questions no one could answer alone.
“One has to develop a kind of new lexicon,” Royston says. “It can be a real opportunity because it means you’re forced to think about problems in a completely different way.” When researchers are pushed to translate their thinking for someone outside their field, it can expose the blind spots inherent to their own expertise. That shift in mindset, he explains, often leads to mental breakthroughs.
This kind of cross-pollination is the foundation of Royston’s laboratory and the reason it now includes a new type of researcher. Not a person, but a machine learning model. Designed to be trained, tested, and refined by humans, the model is being taught to recognize diagnostic patterns in bone marrow samples that are often too nuanced, too inconsistent, or too complex for the eye alone.
When naïve questions lead to new insights
In the collaborative environment of Royston’s laboratory newcomers, often early-career trainees, are encouraged to speak up. And it’s frequently their “naïve” questions that push science forward.
Royston recalls these moments as he drives home from work and smiles — the unexpected insights that surface while explaining pathology to new students. “One of the privileges is working with bright and able students,” he chuckles. “I’m always astonished at the number of occasions where someone makes a comment or insight that I’ve never thought of. It’s often the naive questions that are the most revealing.”
That curiosity and openness shapes how the team approaches one of the most difficult challenges in hematopathology: reading bone marrow trephines. These cylindrical samples, typically extracted from the hip bone, contain a dense landscape of cell types, fat, connective tissue, and bone. Pathologists trained in hematopathology synthesize all of this into a diagnosis, maybe a fibrosis score, and a two-paragraph report.
But in MPNs, where disease can appear patchy, even a single biopsy can contain both healthy and fibrotic tissue side by side. “Non-fibrotic” and “fibrotic” labels often fail to capture that nuance, and even expert pathologists may disagree on how to grade the same sample.
So, Royston’s laboratory is exploring a new question: how can you teach a computer program to interpret that complexity and offer clarity where human interpretation may diverge?
How to train your dragon student machine learning model
Building a machine learning model is much like mentoring a new scientist. It’s a meticulous process that requires expert guidance, curated lessons, and constant feedback.
For machine learning, the most challenging aspect of training might be gathering teaching materials. Before a model can recognize abnormal biology, an expert must first define it, categorizing examples of healthy versus unhealthy tissue. But unlike a student with intuition, a nascent computer program starts at zero. Teaching it takes terabits of data, and thousands of hours are spent identifying, labeling, and building image libraries.
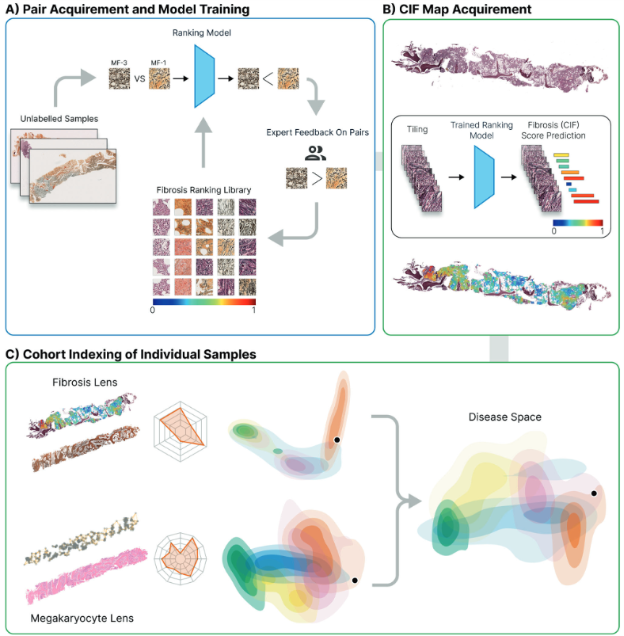
Caption: Outline of the computational steps necessary for bone marrow trephine fibrosis (reticulin) detection, quantification, and visualization. A) First, images are manually selected which indicate fibrosis and labeled with a fibrosis grade according to an expert. These tiles are used to train a machine learning model. Human-in-loop judges the model’s response. B) Second, trephine tissue samples new to the model are graded using on the continuous indexing of fibrosis (CIF) score. A color map of fibrosis is superimposed upon the reticulin-stained image. C) Finally, by analyzing patterns in fibrosis scores, the researchers created a two-dimensional map that shows how different MPN subtypes relate to each other. This map allows researchers to compare individual patient’s bone marrow to a library of others — and when combined with features from other cells like megakaryocytes, it may improve how we identify and track disease. Ryou, H., et al, Leukemia, 2022
Royston recalls, “The very first project we worked on was looking at megakaryocytes and that involved me drawing around several thousand megakaryocytes on the slide to identify candidate megakaryocytes that were then used to train the model.”
Everything the machine learning model learns must first be precisely described, shown, and explained again, and again, and again…
“And through multiple rounds, iterative rounds of training and retraining, we were able to get to a position where the model could accurately predict megakaryocytes. So, for the first round, for example, we’d get maybe 50% of the predictions correct. We would inform the model “that’s a correct call,” “that’s a negative call,” retrain the model multiple rounds until eventually you get very high levels of accuracy of the megakaryocytes predictions.”
This process, known as human-in-the-loop model training, is hands-on and labor-intensive. “Many of the conventional approaches require a lot of human labeling,” Royston says, “where a specialist like myself works with a model as it’s trained to try and improve and refine the training.”
Once trained, the model is tested on new biopsy images to see how well it can apply what it has learned. Like a student facing a final exam, the model must now prove it can deliver accurate results — even on unfamiliar samples.
Adding data to image analysis
To push their models beyond pattern recognition, Royston’s laboratory is layering in another dimension of data: gene activity.
Using a technique called spatial transcriptomics, the team can map not only what types of cells are present in a biopsy, but also what each of those cells is doing at the molecular level. By overlaying this transcriptomic data onto high-resolution images of bone marrow tissue, they can build a molecularly informed map of the entire sample — one that identifies cell types and shows where they’re located in relation to each other.
But for Royston and his team, cataloging the contents of the marrow isn’t the goal. They want to understand the relationships: how cells are organized, what they’re signaling, and what those patterns can reveal about early disease.
“You can look at all of the cell-cell interactions, the spatial relationships of every single cell… begin to learn combinations of cell relationships which are enriched in each of the disease subsets,” Royston explains.
These spatial signatures, invisible to the human eye, may become powerful new tools for distinguishing early myelofibrosis from other MPNs. And because they’re measurable, the results can be compared between patients or even in individual patients over the course of a treatment program.
If this works, it won’t just change how scientists analyze a biopsy. It could reshape how doctors catch progression before it’s visible, offering patients answers earlier, when treatments have the best chance to help.
A model ready to graduate — and prove itself in the real world
Today, the models in Royston’s laboratory are capable of analyzing the complex architecture of the bone marrow with abilities that stretch past those of their human trainers.
“One of the huge powers and the transformational powers of computer vision and machine learning or deep learning is that you can begin to look at an image and really understand in fine detail the features which are different or similar between patient biopsies, different or similar between individual diseases and then look for features or signals that the typical human eye, human brain simply can’t detect.”
Royston’s vision doesn’t end with one laboratory in Oxford. He imagines a future where this machine learning model works alongside pathologists in hospitals around the world, helping reduce diagnostic gray areas and guiding more patients to the right treatment at the right time.
But before it can graduate to routine clinical care, the machine learning models still have critical lessons to learn, beginning with proving it can perform data from outside its laboratory. “The challenge is how do we know it will perform as well on a completely unseen data set,” Royston says. The work of building and curating robust training data is far from finished.
Royston is clear-eyed about what’s next. The model must be clinically validated and tested in prospective studies. It must be adapted into existing diagnostic workflows. If successful, this digital apprentice could become a quiet but powerful presence in cancer diagnosis.
Because in the hardest-to-read cases — when answers matter most — models built by Royston and colleagues could soon help deliver the clarity patients deserve.
Written by: Amielle Moreno, PhD
Sources:
Ryou, H., Sirinukunwattana, K., Aberdeen, A., Grindstaff, G., Stolz, B. J., Byrne, H., Harrington, H. A., Sousos, N., Godfrey, A. L., Harrison, C. N., Psaila, B., Mead, A. J., Rees, G., Turner, G. D. H., Rittscher, J., & Royston, D. (2023). Continuous Indexing of Fibrosis (CIF): Improving the assessment and classification of MPN patients. Leukemia, 37(2), 348–358. https://doi.org/10.1038/s41375-022-01773-0
Sozanska, A. M., Pescia, C., Thomas, E., Royston, D. J., & Cooper, R. A. (2025). Entering the era of spatial transcriptomics: Opportunities and challenges for pathology. Diagnostic Histopathology, 31(5), 257–266. https://doi.org/10.1016/j.mpdhp.2025.03.001